Dashboard Tab
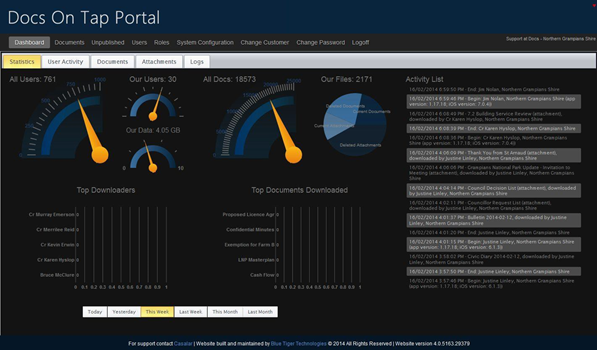
The Dashboard section of the web portal provides a range of snapshots relating to the activty occuring in Docs On Tap for your site.
The Dashboard section comprises the following components:
- Statistics
- User Activity
- Documents
- Attachments
- Logs
Statistics
The Statistics panel displays a range of data relating to activity occurring for your site as well as a snapshot of what is happening in the broader Docs On Tap community:

All Users – displays the total number of users across the entire Docs On Tap community
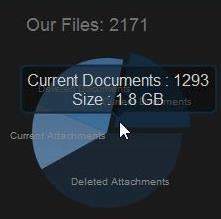
Our Users – displays the number of users setup for your specific site excluding any users who do not have access to the App on a tablet device. Our Data – displays the total amount of data currently used by your site. The maximum amount of available data reflects the amount provided as part of your subscription agreement. All Docs – displays the total number of documents uploaded across the entire Docs On Tap community. Our Files – displays the total number of files uploaded by your site. With the “Our Files” gauge, by floating your mouse over the gauge the system will display the number of files for the selected document type:

Activity List – This list which refreshes approximately every 10 seconds provides a snapshot for all activity that is occuring on your site including on the tablet devices. The type of activity captured in this list includes:
- Users synchronising their devices
- Users downloading documents on their device
- Creation of new users
- Assignment of roles/folder access to users
The data that is displayed here is all captured in the log files accessible in full from the Logs section of the Dashboard tab. The intent of the Activity List is to provide a running display of activity on your site.
Top Downloaders – This section displays a list of those users who are most active in terms of downloading documents for the data period selected – see the Period selection option discussed below. Top Documents Downloaded – This section displays a list of the most frequently downloaded documents for the date period selected – see the Period selection option discussed below.
Period Selection – This section enables you to modify the period for which the Top Downloaders and Top Documents Downloaded are based on. To modify the period referenced by both these charts simply click on the period range that you require, the options of which are displayed below:

User Activity
The User Activity panel provides the ability to view the recent activity of all users registered in the system for your site.
Displaying the date the user last synchronised their tablet device as well as downloaded a document:

By floating your mouse over the points on the line chart the details for the selected user will be displayed.
Documents
The Documents panel provides a list of all documents that have been uploaded into the system (both current and deleted documents) and identifies which users have downloaded the document.
By clicking on the  icon next to the name of the document details of any attachments associated to the document will be displayed as well as a list of users with the appropriate date and time stamp who have downloaded the document as shown below:

The time stamp reflects the actual time that the end user tapped on the document for the first time in the tablet app and downloaded the file.
Displayed documents can be filtered by entering text into the filtering row at the top of the Grid. This performs a case insensitive “contains” search e.g. entering “Agenda” would cause only documents that had the word, or part word, “agenda” in their title to be displayed.
The sort order of displayed documents can be changed by clicking on the column headers.
Attachments
Similar to the Documents panel described above the Attachments panel provides a list of all attachments both current and deleted that have been added into the system with the ability to view who has accessed the documents.
Displayed attachments can be filtered by entering text into the filtering row at the top of the Grid. The filtering works as described above in the documents section.
The sort order of displayed attachments can be changed by clicking on the column headers.
Logs
The logs panel provides a complete history of the activity that has occurred for your site from the start of the previous month. This is clearly shown on the Log Page when you access it:

All history contained in the log file is automatically archived after 2 months. At any point in time should your site require access to the Log file for a period prior to that which you can access via the portal then please contact Casalar Software. All archived data is maintained and is readily accessible should your site have a need to go back and look at previous activity.
Displayed logs can be filtered by entering text into the filtering row at the top of the Grid. The filtering works as described above in the documents section.
The sort order of displayed logs can be changed by clicking on the column headers.